
Huntington, WV
|
|
Marshall University Huntington, WV |
|
Little Coal River Biological Assessment - In-Stream Structures - |
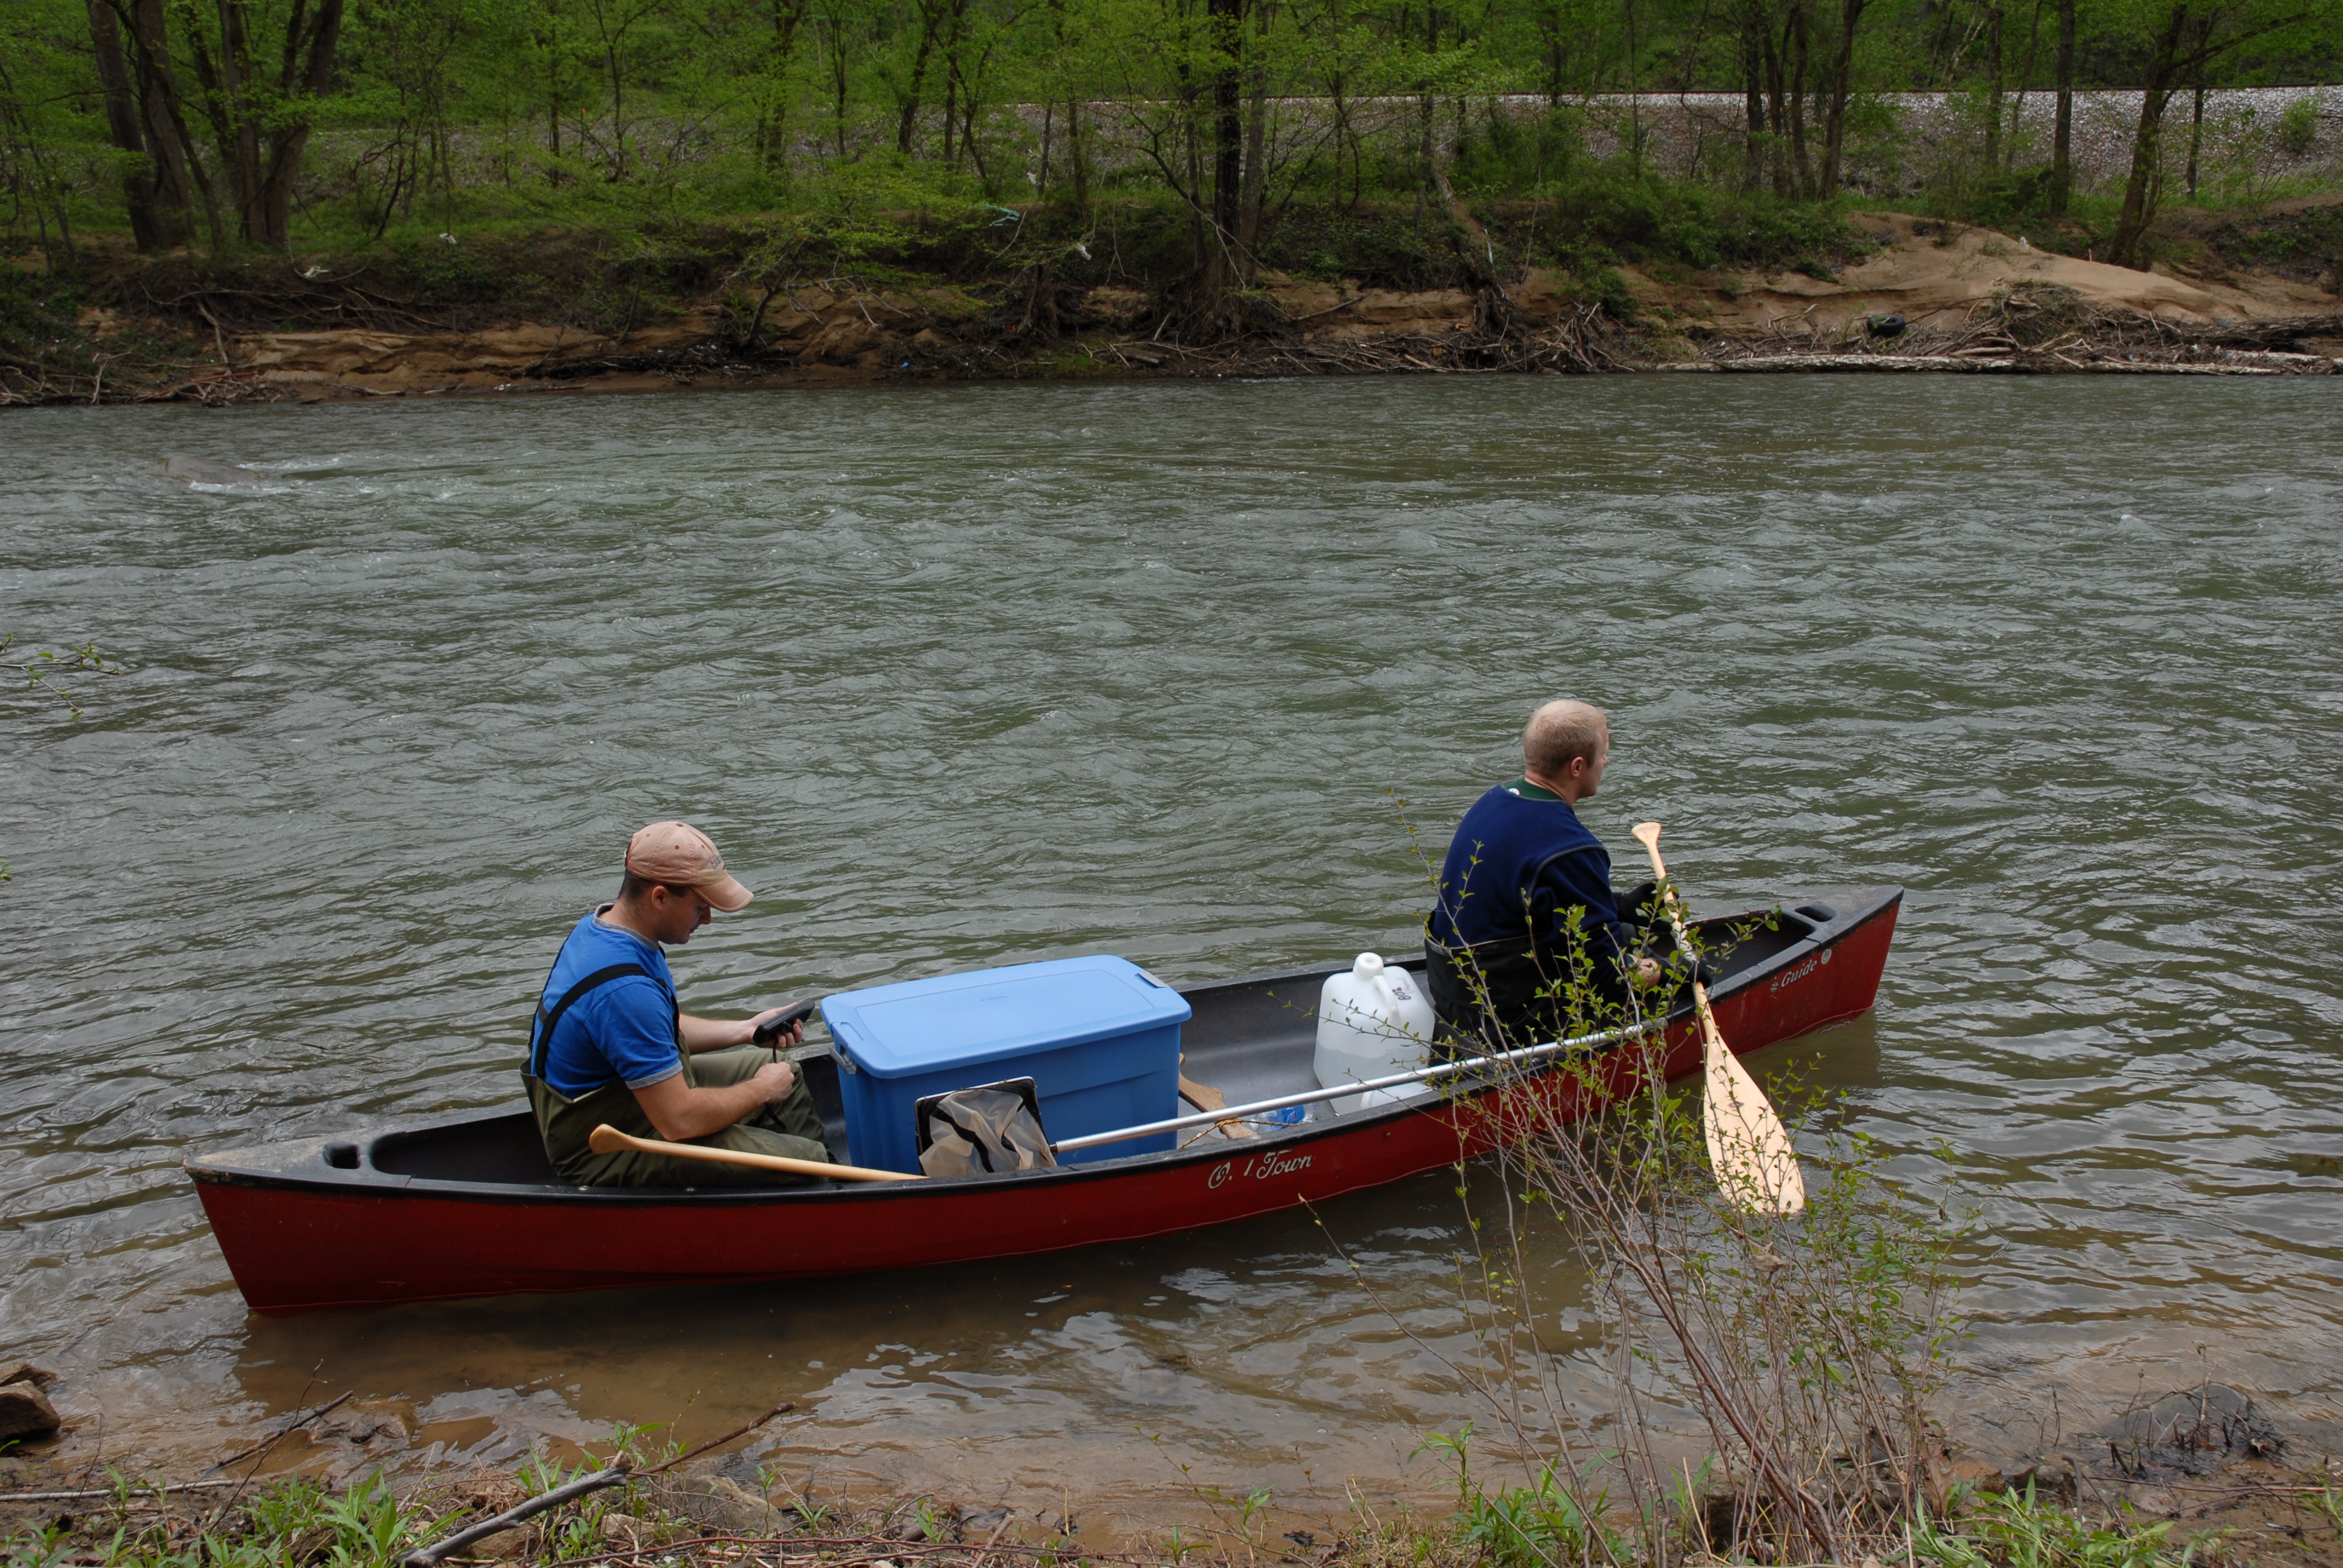
Remediation in the Little Coal River included the addition of in-stream structures such as cross vanes, J-hooks and others. The goal of these structures was to create areas of faster moving water which would help wash some of the silt and sand off the bottom of the river. When the bottom of the river is more diverse, many more organisms such as bugs, fish and even freshwater mussels can utilize the variable habitat.
|
|
|
|
| Cross vane structre | J-hook structure | Boulder structure |
|
|
|
Structure placement points along a five-mile stretch of the Little Coal River. |
|
|
|
Little Coal River bottom composition before addition of structures. |
|
|
|
Little Coal River bottom composition after addition of structures. These data were collected in June 2007. |
|
|
|
Little Coal River bottom composition after addition of structures. These data were collected in June 2008.
|
|
|
| These images represent the change in substrate from before the addition of the Rosgen-type structures to the time of sampling. The image on top shows changes in substrate that had taken place up to June 2007. The image on the bottom represents changes that had taken place up to June 2008. Any green represents a change from a lower substrate class (like clay or sand) to a higher one (like gravel or boulder). Ay red represents a change in the other direction. Black sections indicate no change. |
|
|
|
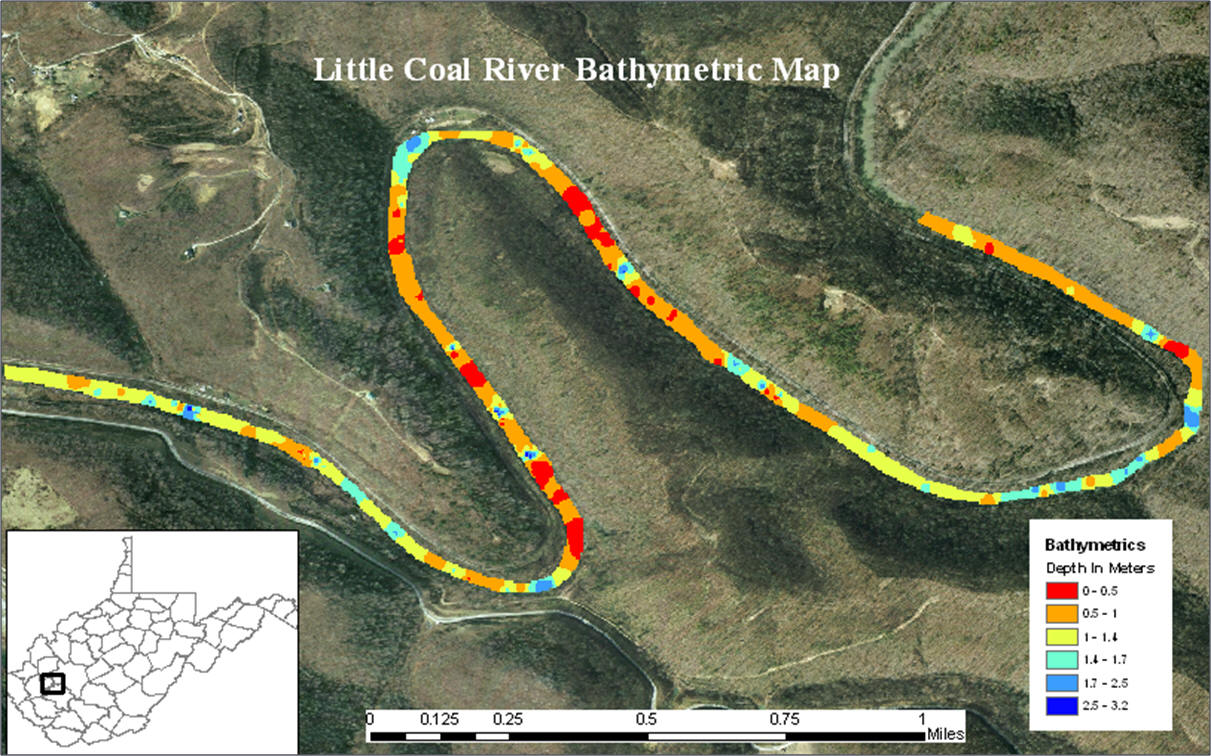
Little Coal River bathymetric (depth) profile before addition of structures.
|
|
|
|
Little Coal River bathymetric (depth) profile before addition of structures. These data were collected in June 2007.
|
|
|
|
Little Coal River bathymetric (depth) profile before addition of structures. These data were collected in June 2008.
|
|
|
|
These images represent the change in depth from before the addition of the Rosgen-type structures to the time of sampling. The image on top shows changes in depth that had taken place up to June 2007. The image on the bottom represents changes that had taken place up to June 2008. Any green represents a change from a shallow to deeper. Any red represents a change in the other direction. Black sections indicate no change.
|


